
The air made visible

Airmeter turns live air quality data into something you can see. Using your location, it pulls local readings for PM2.5 and NO₂ (fine particles and nitrogen dioxide, much of it from traffic) and transforms them into a particle field that drifts in front of you.
Clean air is a few faint specks. Heavy pollution becomes a thick, slow haze closing in around you. You feel the air quality instead of just reading it.
You can also compare air quality in cities around the world, and on Meta Ray-Ban Display, see a 7-day trend and the best time to head out.

Feature 01
See live readings for PM2.5, PM10, NO₂, SO₂, pollen and humidity as particles filling the room around you, wrapped in a fog that thickens as pollution rises.
Feature 02
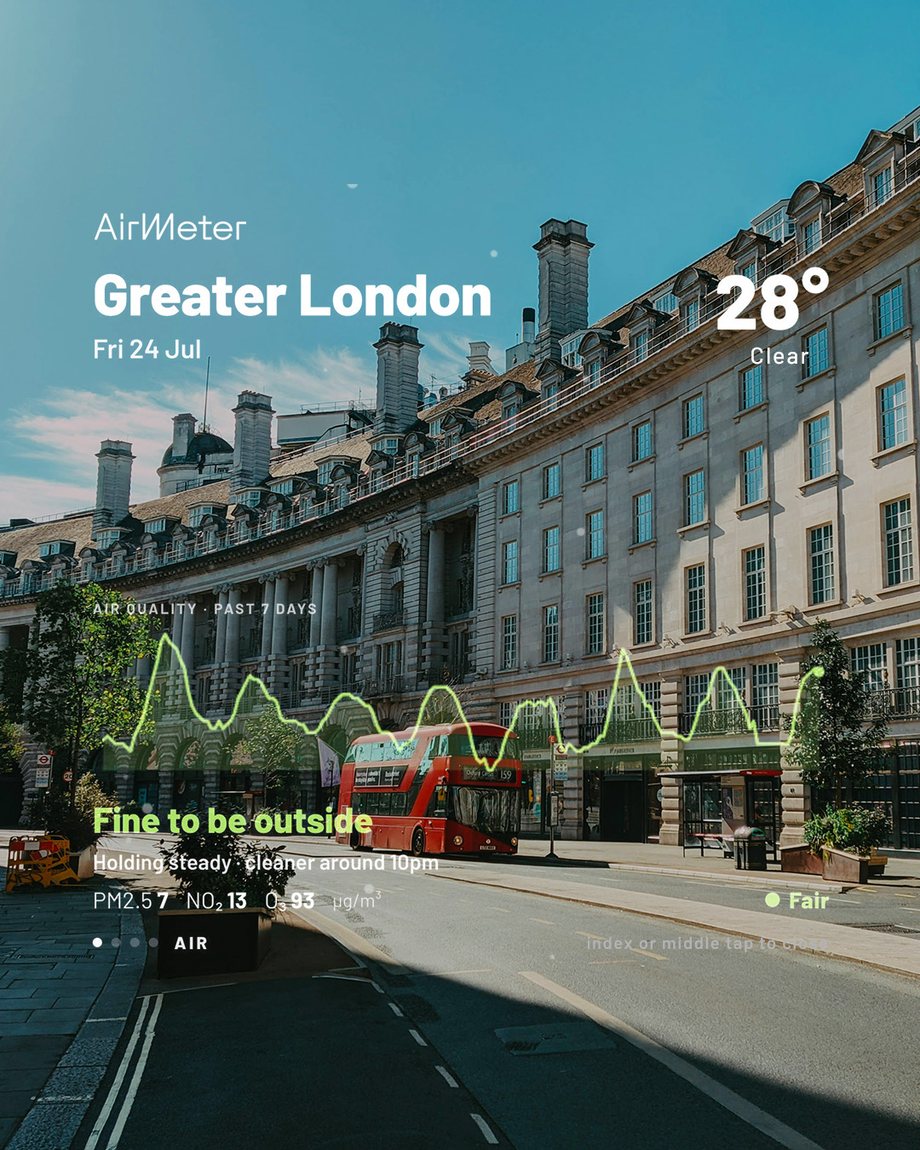
A 7-day chart shows how your local air has been changing, with plain advice like “Fine to be outside” and a heads-up on when the air will be cleaner. Live PM2.5, NO₂ and ozone readings sit just below.
Feature 03
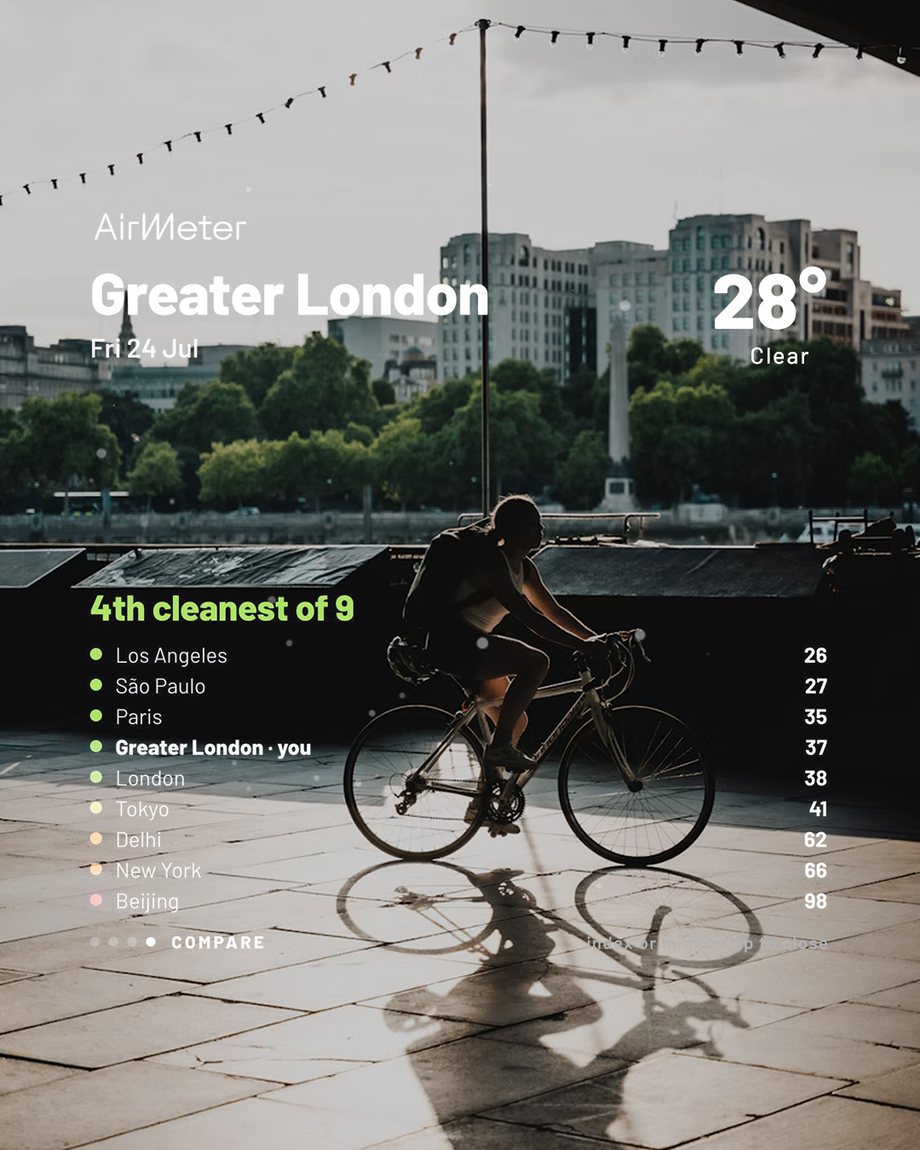
See how your air stacks up against cities around the world, from Paris and São Paulo to New York and Tokyo, and where your city ranks today.
Feature 04
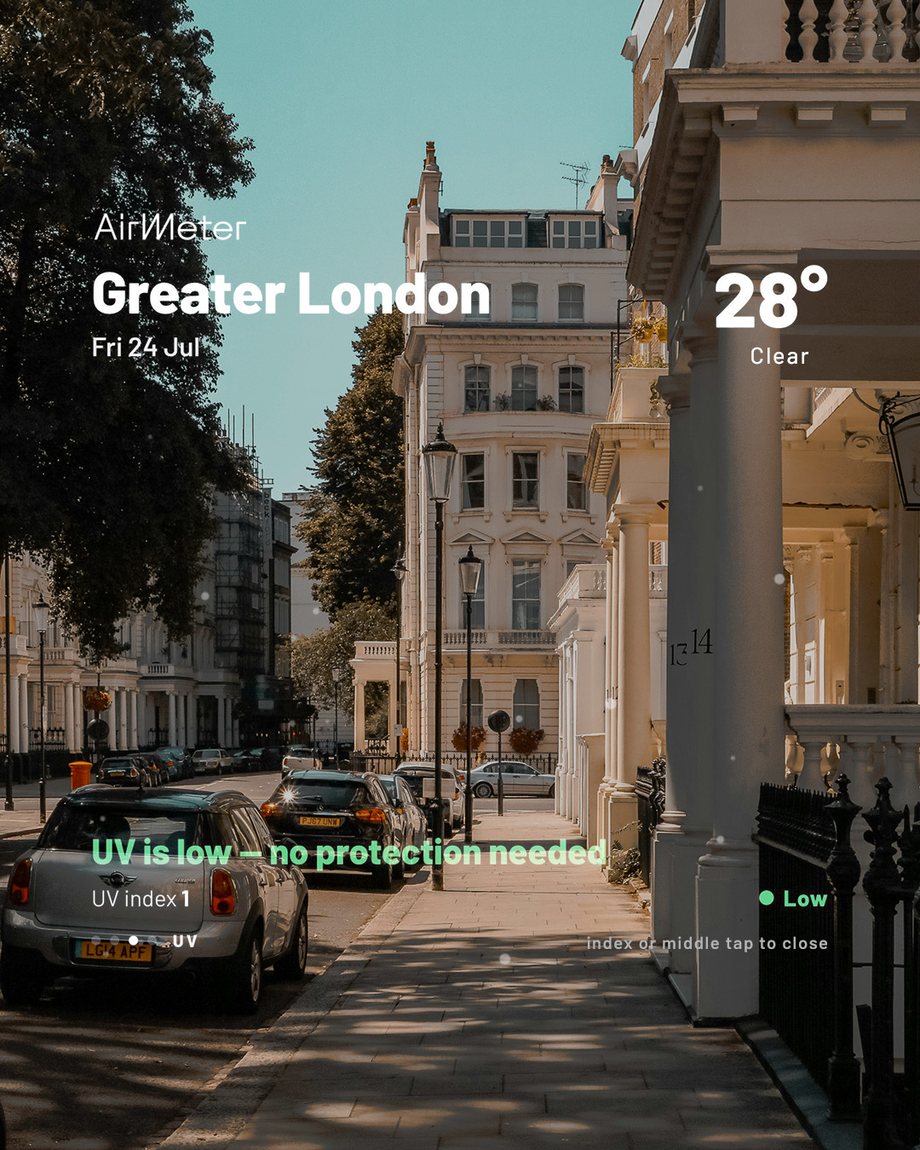
Swipe across for the UV index and other conditions, each with a simple verdict, like whether you need sun protection today.
Feature 05
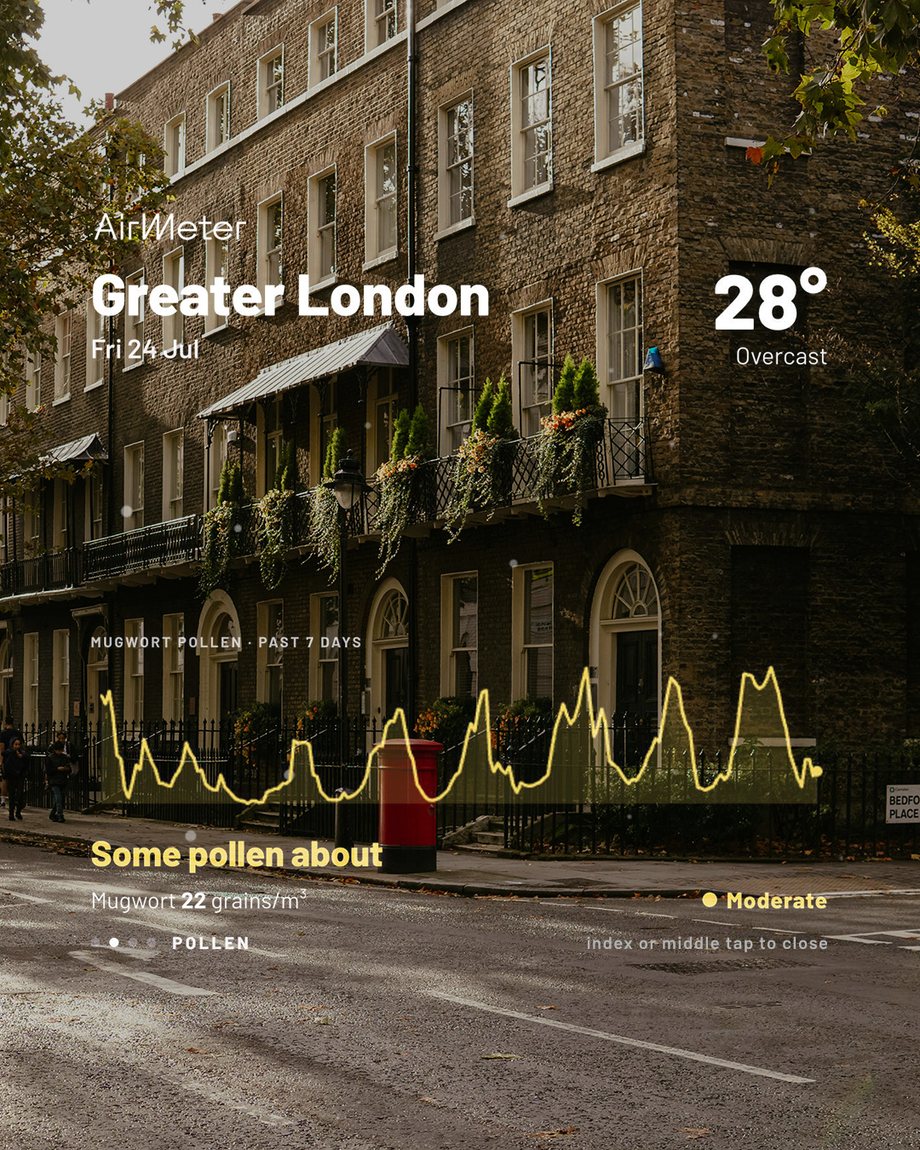
Airmeter tracks pollen down to the type, like mugwort, with a 7-day chart and a simple verdict such as “Some pollen about”, so hay fever doesn't catch you off guard.
Airmeter shows far more than one number. Alongside fine particles (PM2.5 and PM10), it tracks nitrogen dioxide (NO₂), sulfur dioxide (SO₂), pollen, humidity and even mosquito activity, so you get a fuller picture of the air where you are.
“PM2.5 is considered the most dangerous air pollutant because of its size and ability to penetrate deep into the body.”
Clean Air Initiative, What is PM2.5?
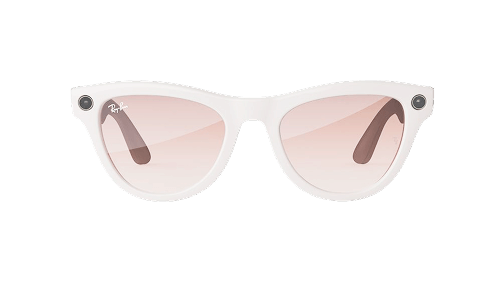
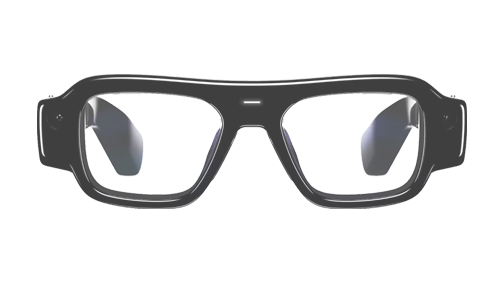
We'll work with you to launch a version built around your community, connected to your local monitoring network and branded for your area, with localized health guidance and room for sponsor partners. Whether you're a public health body, NGO, local government or philanthropic funder, get in touch.
Airmeter runs on open data. Air quality, pollen and UV come from the Open-Meteo Air Quality API, built on the EU’s Copernicus Atmosphere Monitoring Service (CAMS). A single request brings in live PM2.5, NO₂, ozone, the European AQI, UV and six types of pollen, along with seven days of hourly history for the trend graph and a day of forecast. Weather comes from Open-Meteo’s forecast API, the city comparison checks eight cities in one request, and place names come from OpenStreetMap.
Weather and air quality data by Open-Meteo.com (CC BY 4.0), based on Copernicus CAMS. Place names © OpenStreetMap contributors.
We care about your privacy.